![]()
![]()
![]()
![]()
|
|
|
|
|
The principle in the Brain DB editor is to work from top to bottom following the numbering of the elements.
Steps for creating a new Brain DB (or Brain Norm)
1. Create empty Brain Norm
Activate the Create new norm button.
In the appearing dialog select the PMOD database in which the Brain DB definition will be saved, then enter a DB name,
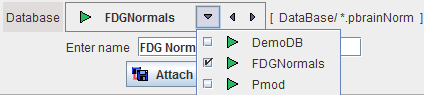
and activate the Create ne Brain Norm entry button.
2. Specify Normalization Template
Define the template used during the stereotactic localization.
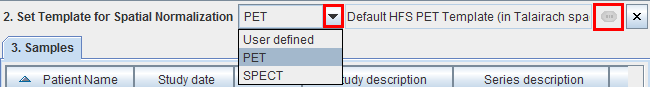
The list selection allows switching between standard MNI templates for PET and SPECT, or alternatively a User defined template. With User defined please use the button to select the template in a database (files outside databases are not supported).
The defined template will serve as the reference image (representing the stereotactic anatomy) during the spatial normalization of all control and patient images. For new tracers, the user may first have to generate a suitable template outside the brain database tool.
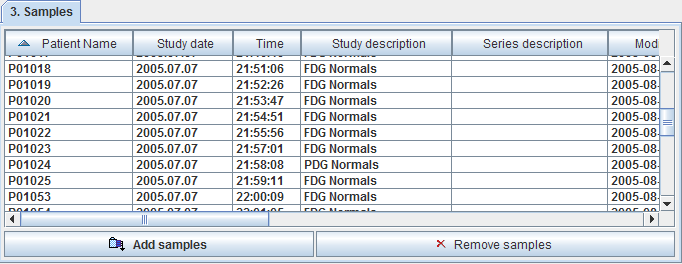
3. Add Control Samples
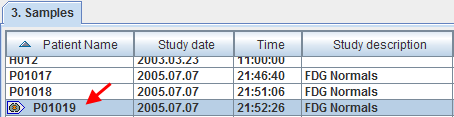
The button Add samples brings up a database selection dialog. In this dialog bring one or more image sets of normal controls into the Selected for loading area and quit with the Set series button. The samples are listed in the Samples section
4. Define the Spatial Normalization and Normalize the Samples
The next step is to define how the stereotactic normalization of the control samples is performed.
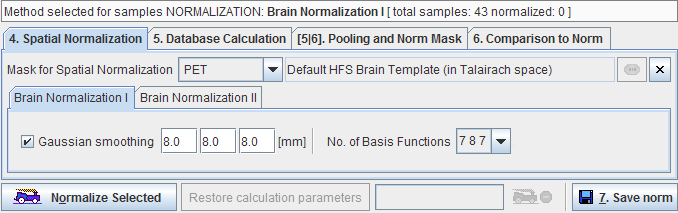
A mask is required to cut off signal from outside the brain. It is specified using the Mask for Spatial Normalization selection. For the standard PET and SPECT templates there are default masks available, for User defined templates the user has to select an appropriate mask series in a database.
Since the normalization template is typically quite a smooth image, a similar smoothing of the target images is also needed. To this end a Gaussian smoothing filter may be defined by its full width at half maximum in all directions (x,y,z). An additional selection allows switching between three different function bases.
Then normalize the control images by selecting the new samples in the list and activate the Normalize Selected button. The normalization is performed in the background, and finally confirmed by a message. Note that control data which have already been normalized are marked in the Samples list with a special symbol.
Note that although smoothing is applied for the purpose of the normalization, the resulting normalized images are not smoothed by the specified filter.
5. Define the Database Properties
The database properties are defined on two tabs. The first contains the following:
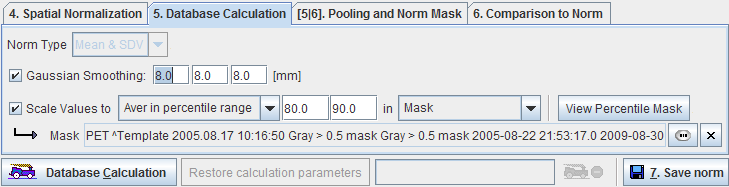
A Gaussian smoothing filter is available for smoothing the normalized control images before the database calculations.
In order to perform a pooled analysis it is required that the control images have comparable pixel values. In most cases the image values must therefore be scaled. This is achieved by scaling the pixel values by the inverse pixel average in stable reference tissue. Several user interface elements in the Scale Values to line allow flexible scaling strategies.
The first selection lets define how the reference value is calculated within a spatial extent defined by the second selection.
Aver |
Average value in the reference pixels. |
Max |
Maximal value in the reference pixels. |
Aver above % of Max |
Average of those pixels in the selection which are larger than the entered percentage of the reference maximum. |
Aver in percentile range |
A pixel value histogram is done in the spatial selection. The average value is calculated in the percentile range value specified. |
The second selection allows defining the spatial extent within which the reference value is determined. The restrictions are
VOI |
A volume-of-interest which can be selected in the database. |
Mask |
A mask file which can be selected in the database. |
Sample |
No restriction, all data pixels are used. |
In the example shown above the average is calculated of all pixels in a gray matter mask which are in the 80% to 90% percentile range. This definition may represent an approach to exclude diseased hypometabolic (low pixel values) and activated (highest values) pixels.
The z-score calculation is based on the standard deviation of the normalized values across the controls data sets. If the number of control samples is low, the statistical power may not be sufficient for calculating reliable standard deviations in each individual pixel. In this case Variance Pooling on the Pooling and Norm Mask tab should be enabled.
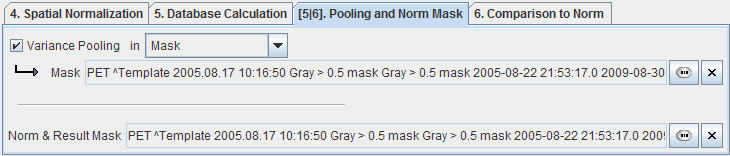
If Variance Pooling is enabled, the user can define a spatial extent, in which the pixel standard deviations are averaged to derive a pooled standard deviation which will be used for all pixels. A VOI, a Mask, or the whole Normalized sample can be employed for variance pooling. Finally, a Result Mask is needed outside which the calculation results are cleared because they are meaningless.
6. Define z-Score Calculation
The patient images which are to be compared against the Normal Database are also first normalized. The smoothing filter during this normalization can differ from the filter applied to the control image normalization and can be specified with the Normalization Gaussian Smoothing values. Due to the pooling of many samples and some optional filtering, the database is inherently smoothed. Therefore, some smoothing of the normalized patient images is most likely required to reduce disturbing edge artifacts. This smoothing can be specified with Z-Score Gaussian Smoothing values.
7. Database Calculation and Saving
After these definitions have been completed, the Normal Database can be calculated. The button Database Calculation initiates the calculation encompassing all samples which have been added and normalized. The following processing steps are performed.
As a result, the average value (representing the expected normal value) and the standard deviation (a measure of uncertainty) are known. These results are saved in the database as new series of the normalization template study (MEAN, STDV).
At the end, save the database using the Save norm button.
Note: New samples can incrementally be added. In this case, and if one of the definitions has been modified, it is required to recalculate the database.