![]()
![]()
![]()
![]()
|
|
|
|
|
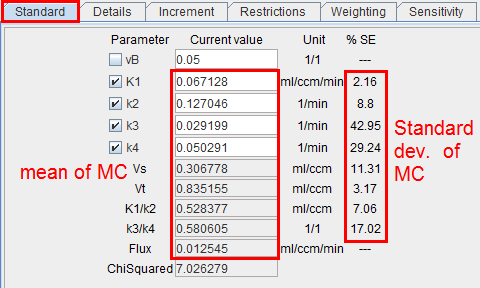
The purpose of performing Monte Carlo simulations in kinetic modeling is to get information about the standard error of the parameter values found in a fit. There are two different kinds of sources which contribute to the uncertainty of the parameters:
The paradigm used for performing Monte Carlo simulations is described by Flannery et al. [11]. The basic idea is to simulate a series of measurements and statistically analyze the results when modeling these synthetic "measurements".
In PKIN Monte Carlo simulations can be performed for compartment models applied to a single tissue (Mt-Carlo) and models coupled across several tissues (Coupled Mt-Carlo) by selecting the respective panes.
Single Tissue
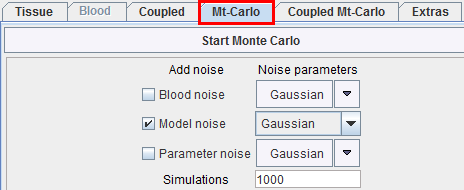
Three types of "noise" can be defined. For each "noise" the distribution type as well as the variance has to be configured. After selecting the distribution a dialog window appears for defining the variance as described in the Residual weighting for model fitting.
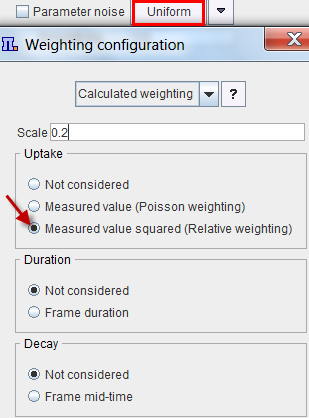
Three distributions are available for noise generation, Gaussian, Poisson and Uniform. They are applied for each individual measurement with the prescribed variance. There are definitions with constant standard deviations for all time points, and others with variable standard deviations.
When the Start Monte Carlo button is selected the following processing starts:
It is possible to visualize a summary of the fit results during the Monte Carlo runs by switching back from the Tissue to the Mt-Carlo pane. In the curve display, a new curve Monte Carlo appears with vertical bars. The end points of these bars mark the minimal and the maximal value that any of the resulting model curves reached at a particular time point.
Several Tissues Coupled
The same principle as for the single tissue Monte Carlo simulation applies to the Coupled Monte Carlo simulation (Coupled Mt- Carlo tab). In the upper section, the coupled parameters and the regions to couple are defined. In the lower section, blood and parameter noise can be specified. When starting, an initial coupled fit is performed to find the "true" parameters and the "true" model curves. Then, noisy curves are generated and coupled fits performed. At the end, the mean and standard errors are available as the regional parameters.