![]()
![]()
![]()
![]()
|
|
|
|
|
After the VOIs have been defined the

button becomes active. When it is selected the following processing steps are performed:
Note: If complete data is available in the Rest and Stress rows, the above processing is performed for both of them.
The behavior after completion of the TAC-calculations depends on the configuration of the KM buttons on the Kinetic Modeling page:
|
With this manual configuration the PCARD tool just switches to the Kinetic Modeling page and shows the calculated TACs (recommended). |
|
With this automatic configuration the PCARD starts modeling of the calculated TACs with the configured model immediately in the background. The model is fitted to each of the TACs, the results are returned and then shown on the Kinetic Modeling page. |
Polar Plots of Dynamic Data
The result of radial sampling is visualized on the REST Input or Stress Input tab of the Kinetic Modeling page. The frame selection allows to scroll through the uptake times and monitor the concentration in the sampled tissue voxels. Note that the polar plot is only available with the automatically outlined myocardium VOI.
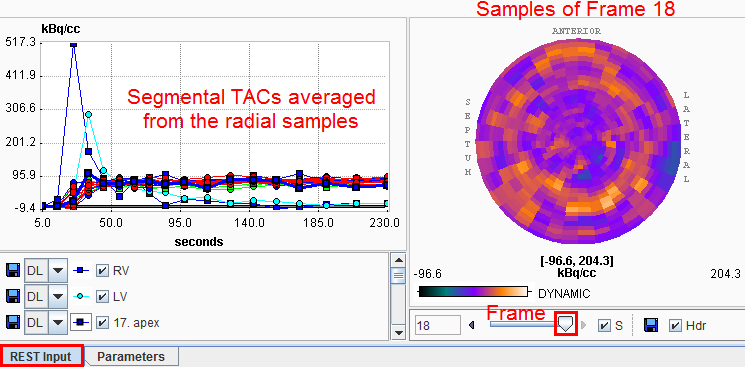
The S checkbox allows syncronizing the polar and image display frames. The dynamic polar sampling can be saved activating the Save icon. Optionally, the header can be appended during the saving procedure enabling the Hdr checkbox. After saving, the polar plots can be analyzed outside PMOD software.