![]()
![]()
![]()
![]()
|
|
|
|
|
The Averaging Dialog
The generation of the anatomical images is controlled by the first group of controls in the processing button area of the rest and stress studies.
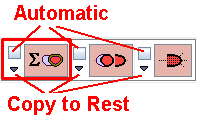
The summation button opens a dialog showing the current averaging parameters. Initially, the parameters are derived from the configuration. However, they can be manually edited if needed.
Activating Yes starts the averaging calculation from the initial dynamic study. If the images were already rotated to the short axis view before, they are set back to the original orientation.
The box next to the average button is for enabling the automatic mode. If it is checked, the averaging process will be performed as soon as image data is loaded using the current configuration.
Note: The small arrows next to the automatic boxes copy a definition from stress to rest, and vice versa. For instance, if the averaging configuration is copied, the same ranges, smoothing and factors will be used for rest and stress.
Identifying Appropriate Frame Ranges
Sometimes the tracer uptake may behave differently so that the default ranges do not result in well delineated anatomical images. In such a case the user should interactively try to optimize the averaging process, because poor images will make the data analysis more difficult.
The Blood range should start with the first frame which shows a strong signal in the right ventricle, and end before the myocardium begins to be clearly seen. Similarly, the Myocardium range should only begin after the signal in the cavities has faded out. It is recommended that the Myocardium range ends after some minutes, because the probability of patient motion increases with the longer frames at the end, particularly if a very long frame is acquired at the end to get images for clinical reviewing.
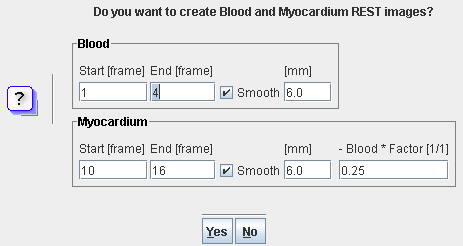
Note that the averaging range is in frame numbers which makes it easier to customize the definition. The examples below illustrate the situation encountered in an ammonia scan. The frames were stepped to the 3rd acquisition, and the thresholds adjusted so that the localization of the blood becomes roughly notable.
The 18th frame of the same study study shows uptake in the myocardium, but is quite noisy due to a short acquisition duration.
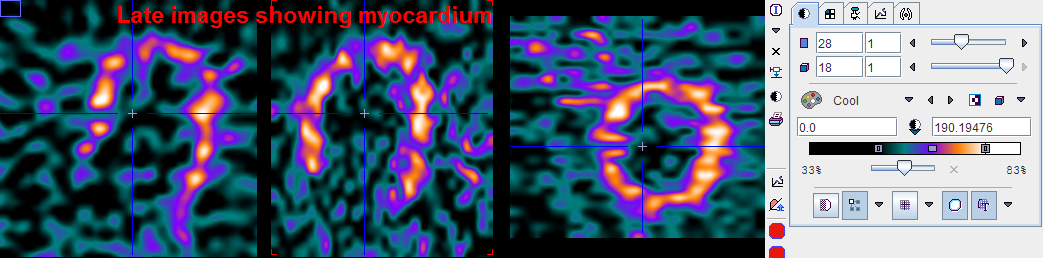
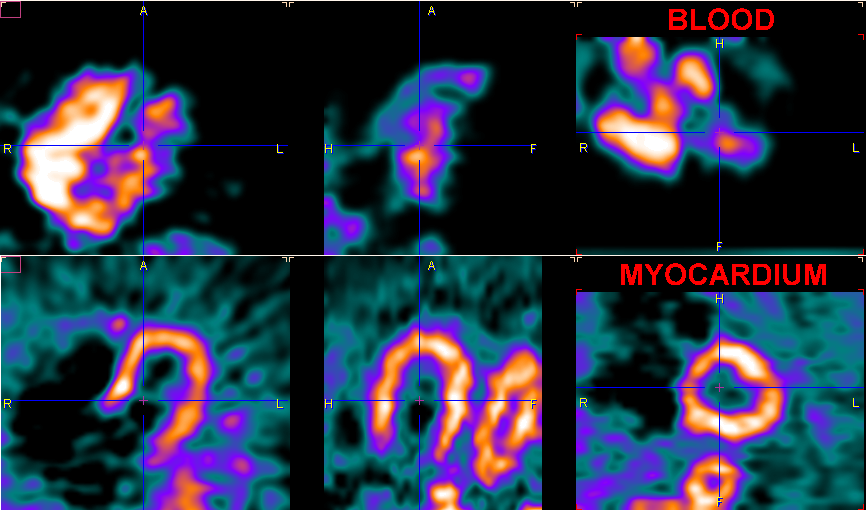
Arrangement of the Result Images
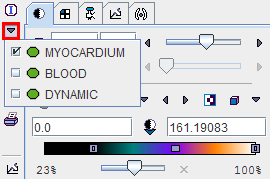
Each time the averaging dialog is closed with the Yes button, two new image studies - BLOOD and MYOCARDIUM - are calculated, and the display is switched to MYOCARDIUM. The user can switch between the original study and the averaging results by the study selection as illustrated below.
The clearer the anatomy is, the better will the automatic procedures work, and the easier will the analysis be. However, typically images of the following quality can be obtained. Due to the increasing dispersion of the bolus it is often difficult get a well delineated LV blood pool.