![]()
![]()
![]()
![]()
|
|
|
|
|
The 4. Results | VOIs page has many helpful analysis functions built into. The normalized patient images and the z-score maps are essentially presented in an image fusion layout. To make optimal use of the available features, please make sure to read the image fusion guide.
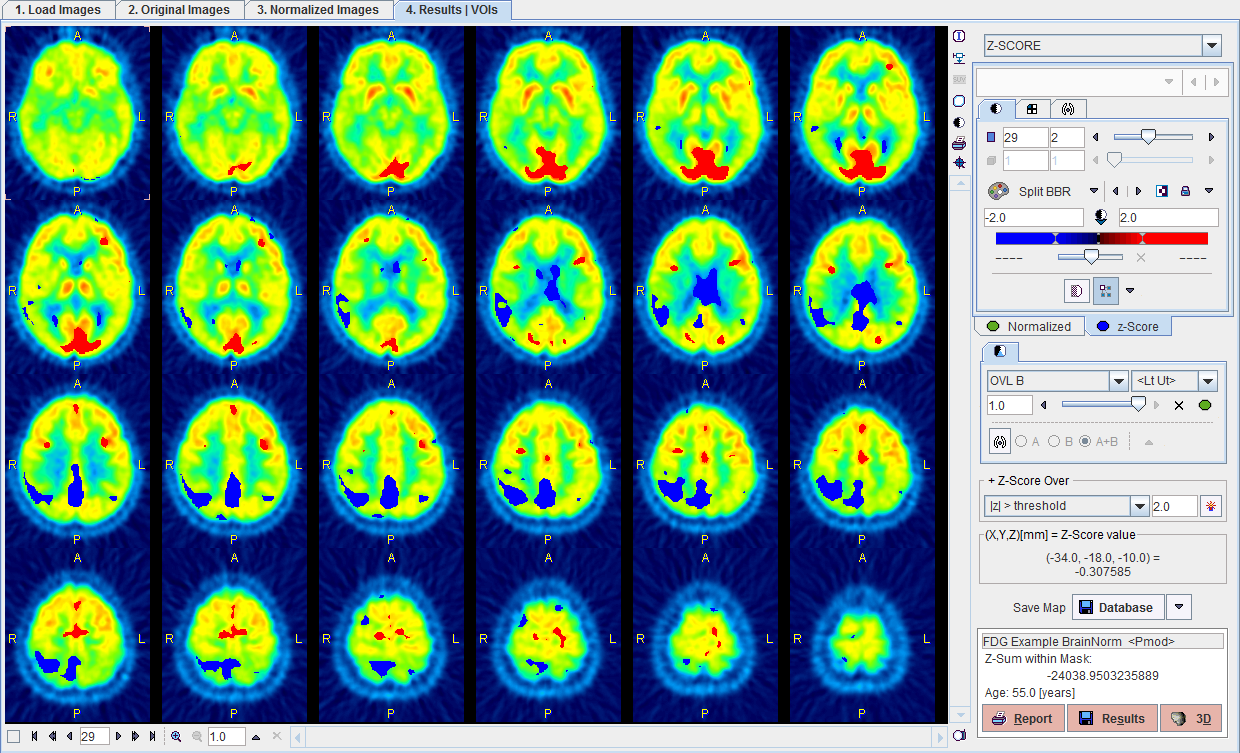
Two types of images are available and fused: the Normalized patient images, and a Z-Score map. The properties of the images can be modified by activating the corresponding tab in the image control area and changing the settings such as the color table and the contrast. When the Z-Score images are active, an additional selection in the top right becomes available
Z-SCORE will show the z-score values in all pixels, while the values in Z-SCORE OVER are truncated according to the threshold configuration. The Z-SCORE OVER map can quickly be recalculated for a different threshold configuration using the button
![]()
in the Z-Score Over section.
Fusion Capabilities
The fusion settings are located below the image controls. There are two selections for choosing between the different fusion renderings, a Contours section for enabling the iso-contour overlays, and the balance slider to blend the contributions of the two images in the fusion.
The fusion methods available are:
MIX |
Alpha Blending: weighted adding of the RGB values of both images. |
OVL A |
Shows the z-score images (B) as background image and a part of the normalized patient images (A) as the overlay. |
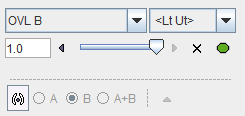
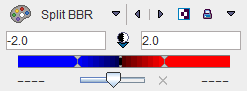
OVL B |
Probably most useful in this context: Shows the normalized patient images (A) as the background image, and a part of the selected z-score map (B) as the overlay. The z-score part to be shown is defined in the threshold selection to the right (see below). |
WIN A |
Shows the z-score images (B) as the background. When clicking into an image a rectangle appears which overlays the patient image (A). |
WIN B |
Shows the normalized patient images (A) as he background. When clicking into the images a rectangle appears which overlays the z-score (B). |
When OVL A or OVL B is selected, different threshold settings are available in the selection to the right:
> Lt |
Only the pixels (in A for OVL A , in B for OVL B) with values above the lower threshold are displayed. |
< Ut |
Only the pixels (in A for OVL A , in B for OVL B) with values below the upper threshold are displayed. |
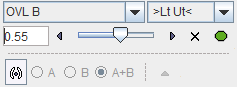
>Lt Ut< |
Only the pixels (in A for OVL A , in B for OVL B) with values between the lower and upper threshold are displayed. |
<Lt Ut> |
Only the pixels (in A for OVL A , in B for OVL B) with values smaller than the lower threshold or greater than the upper threshold are displayed. Note that only the first and last colors of the selected color table are applied in this setting. A suitable selection in this configuration is the Split table. |
For the illustration of some of the capabilities please see the examples below. The full Z-SCORE map is used, and the color table is always configured as
Example z-score overlays:
Only z-score values < -2 and > 2 are shown, without transparency. Because only the minimal and the maximal colors are use, the result has a binary character. Red are all pixels with an activation of more than two standard deviations, and blue all the pixels with the uptake reduced by at least two standard deviations. This is probably the most useful configuration for exploring the deviations from the standard pattern. |
|
Only z-score values between -2 and 2 are shown. Some blending is used to give an impression of transparency. |
|
VOI Statistics
The image display on the fourth page can be switched between the Fusion only Mode shown above and the VOI Mode shown below. The button highlighted by the red rectangle allows rapidly switching between the two layouts.
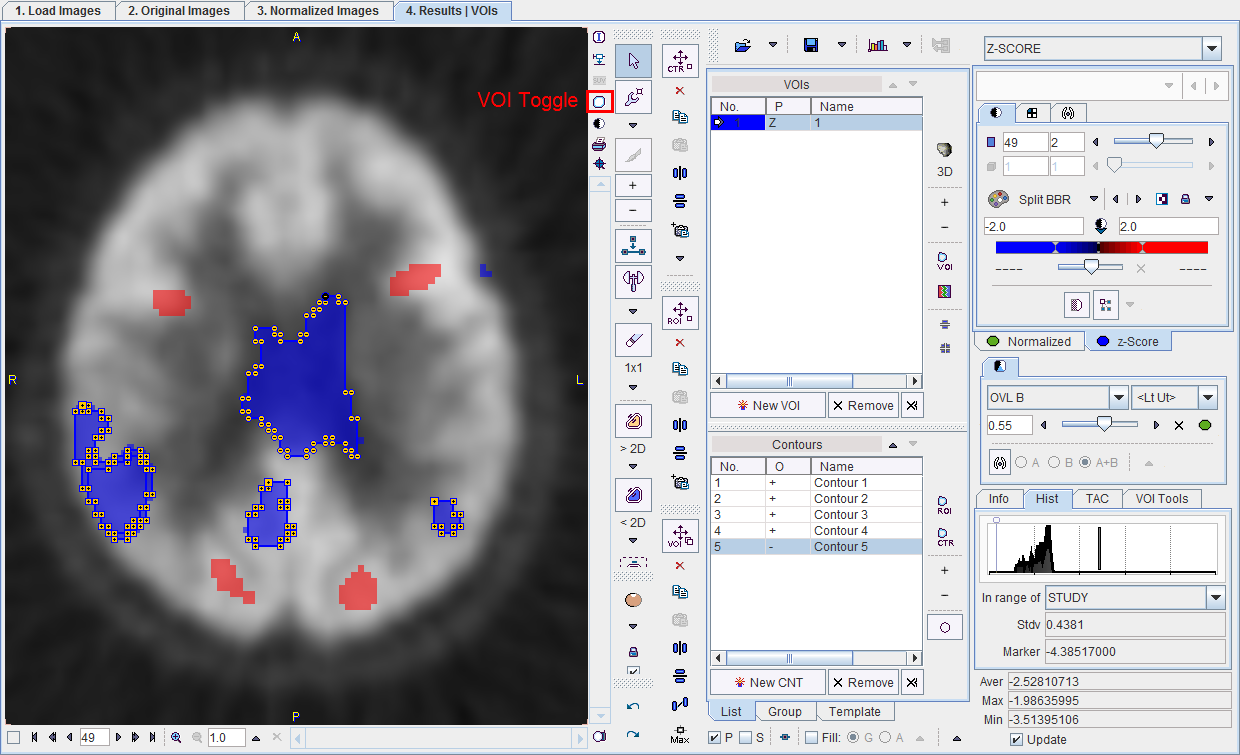
Note: The VOI functionality operates on the images selected by the tab Normalized or z-Score in the image control area.
In the example above, the VOI operations run on the z-Score map. The blue posterior area were enclosed in a rectangle and the three contours generated with the Auto-Isocontour tool. The Histogram tab shows the z-score distribution in the VOI, and an average z-score value of -2.6026. Other VOIs could be added with any of the available tools, and their detailed statistics calculated with the Statistics button. Please refer to the documentation of the VOI tool for an in-depth description of all the capabilities.
Saving Results
The Save Map button in the results area allows saving the z-score maps for use in another context. Please select the map you want to export (Z-SCORE OVER or Z-SCORE), configure the button to the image format of your choice, and then select it for saving.
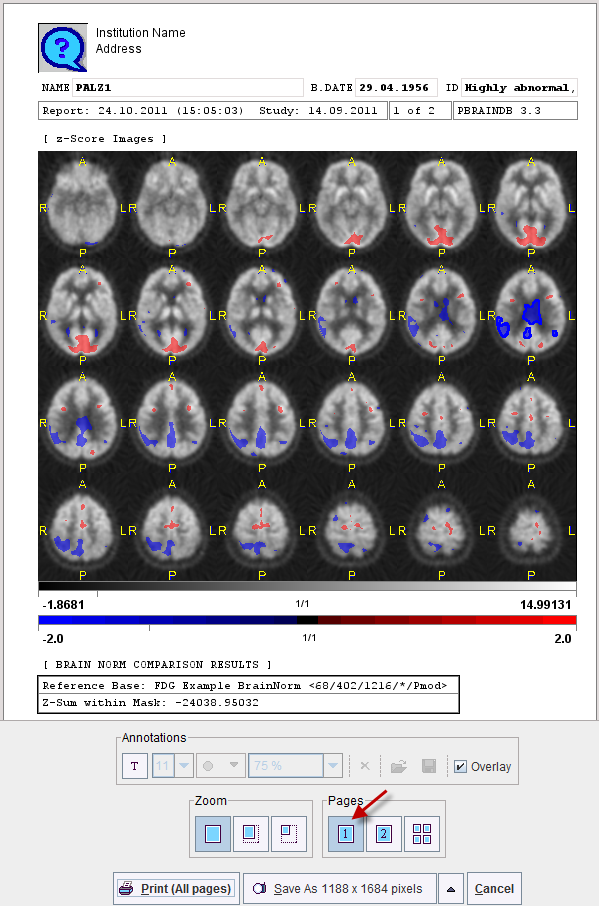
The program calculates the total z-score in the result mask. This information is displayed together with the name of the Brain Norm and the age of the patient. It can be saved to the database or a text file using the Results button in the form of a diskette.
When the Report button is activated, a dialog pops up showing the images in the current configuration together with header information and the z-sum. The page can be annotated, printed, and saved as a JPEG or TIFF file, or as a DICOM secondary capture object. The second page of the report contains a summary of the database configuration, and allows entering comments.
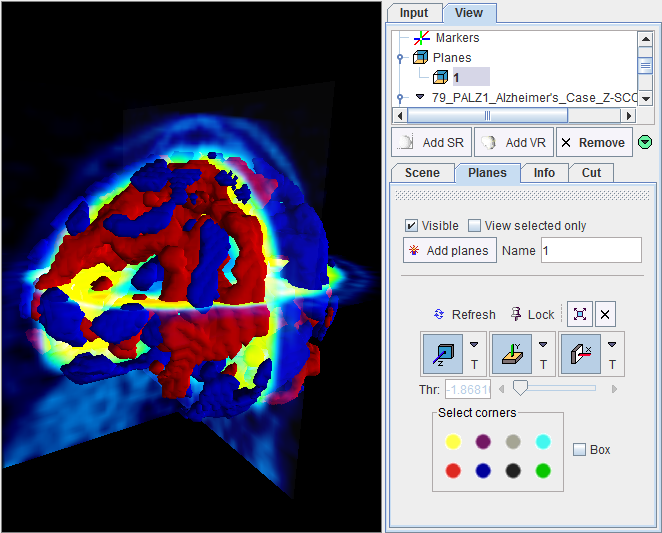
3D Rendering (Option)
If the 3D option has been purchased and installed the button

appears and can be used to rapidly transfer the normalized patient images and the Z-SCORE OVER map to the 3D tool. Rendering is immediately initiated and a result shown such as the example below.
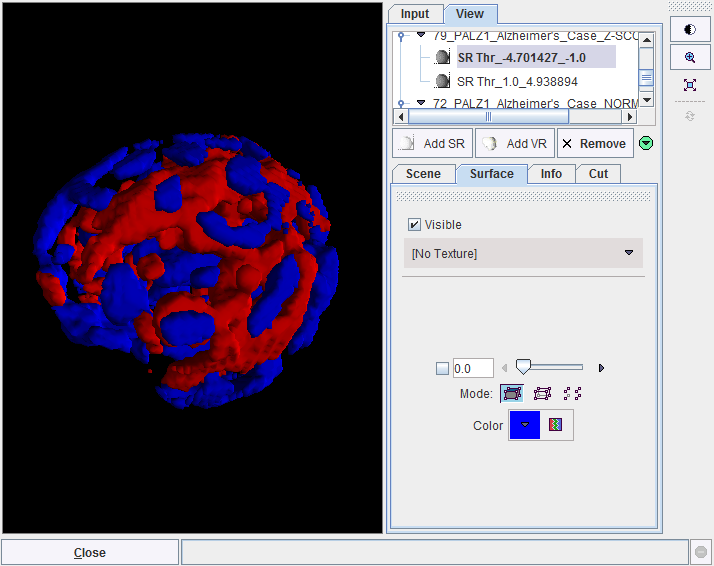
In the example the truncated z-score maps were calculated with |z|>2. Therefore, the red objects enclose all areas with a z-score above 2, while the blue objects enclose the areas with z-score below -2. The scene can interactively be rotated and zoomed. Additionally, more information can be added, for example the brain shape, and/or planes of the normalized images.