![]()
![]()
![]()
![]()
|
|
|
|
|
The 3D tool has a dedicated application for showing a scatter plot of the pixel values belonging to VOIs of three matched studies in PFUS. The example below shows the matched images of a brain tumor patient studied with fluorocholine, fluoroethyl tyrosine, and FDG PET. Two VOIs have been outlined, tumor and gray matter.
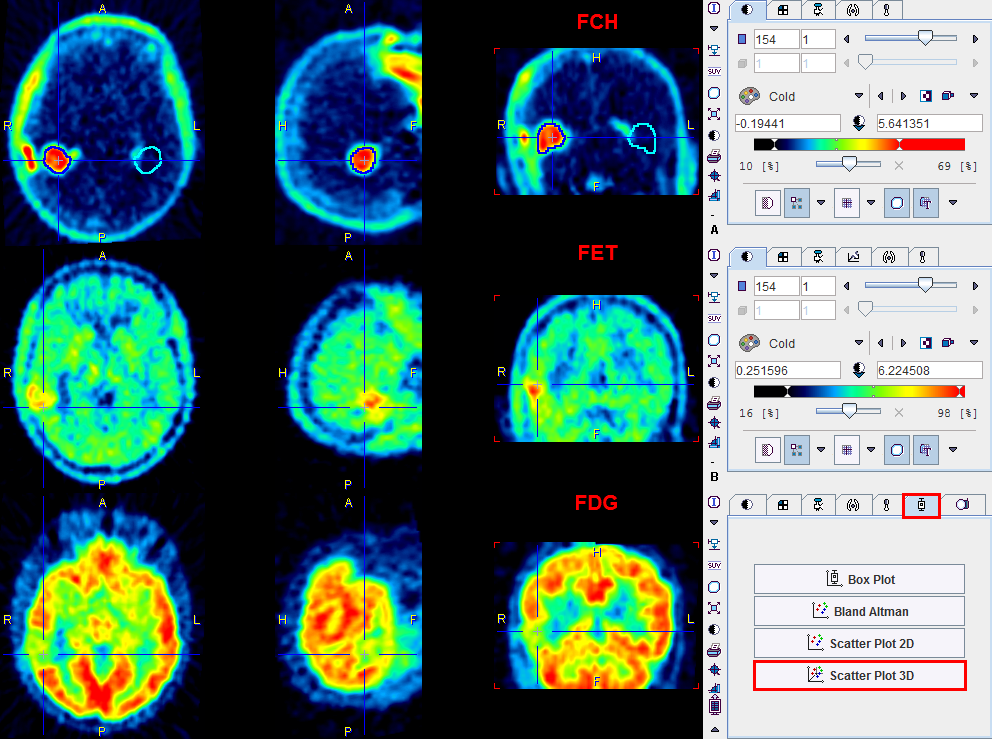
When Scatter Plot 3D is activated, the following rendering is generated. Each pixel is shown as a 3D symbol, with the VOI pixels grouped by the symbol color. In the 3D scatter mode there are some new P3D properties for adjusting the rendering as well as the annotations.
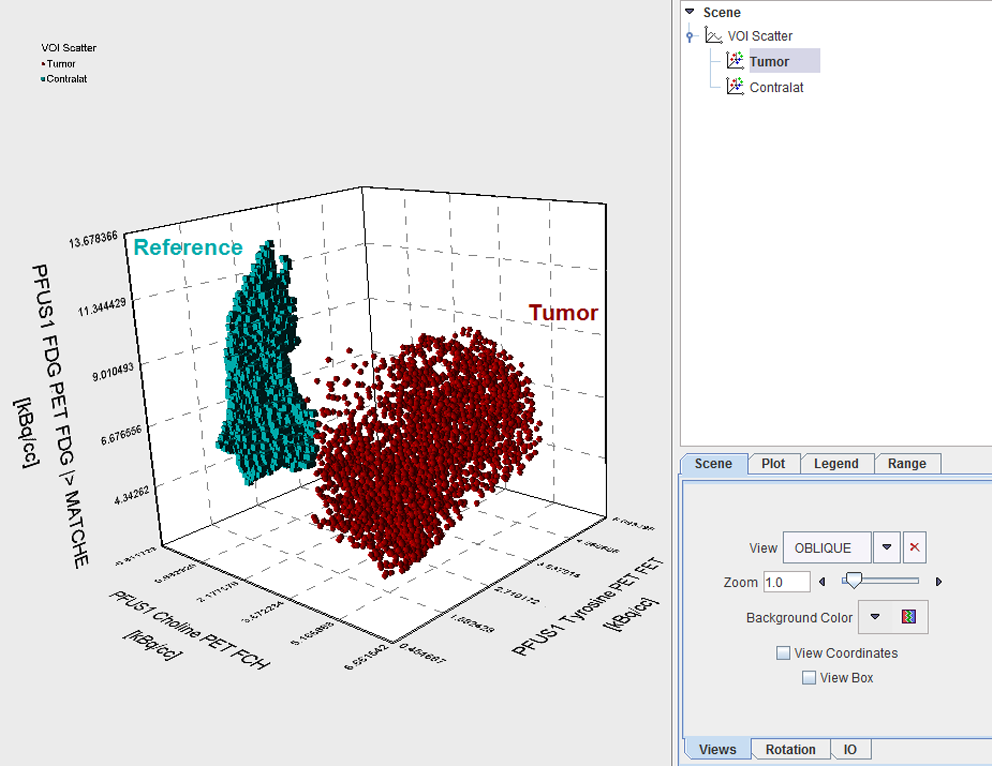
Note that the numeric scatter data can be saved as an ASCII text file for statistical analyses using the Save button on the IO sub-panel.