![]()
![]()
![]()
![]()
|
|
|
|
|
The Vt (3 Calc Methods) model is a convenience model for calculating the total distribution volume of reversible receptor tracers with three different methods:
For the Logan Plot [21] the measured TAC CTissue(t) is plotted as follows using the measured and integrated plasma activity Cplasma(t):
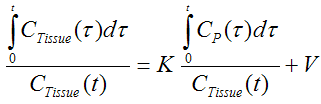
For suitable systems and after sufficient equilibration time this plot will approach a straight line. The slope and the intercept of the line must be interpreted according to the underlying compartment model. The slope K represents the total distribution volume of the tracer (including the blood space).
Ichise's MA1 analysis method is a further development of the Logan Plot aimed at minimizing the bias induced by noise in the measurements. The following bilinear relationship was derived [33]:
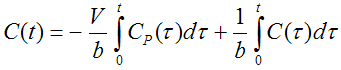
where C(t) represents the tissue time-activity curve, Cp(t) the plasma activity, V the total distribution volume, and b the intercept of the Logan plot which becomes constant after an equilibration time.