![]()
![]()
![]()
![]()
|
|
|
|
|
Acquisition and Data Requirements
Image Data |
A dynamic PET data set representing the measurements of brain activity after injection of a H215O bolus. |
Model Preprocessing
A methodology has been implemented to automatically extract low-flow and high-flow TACs as follows:
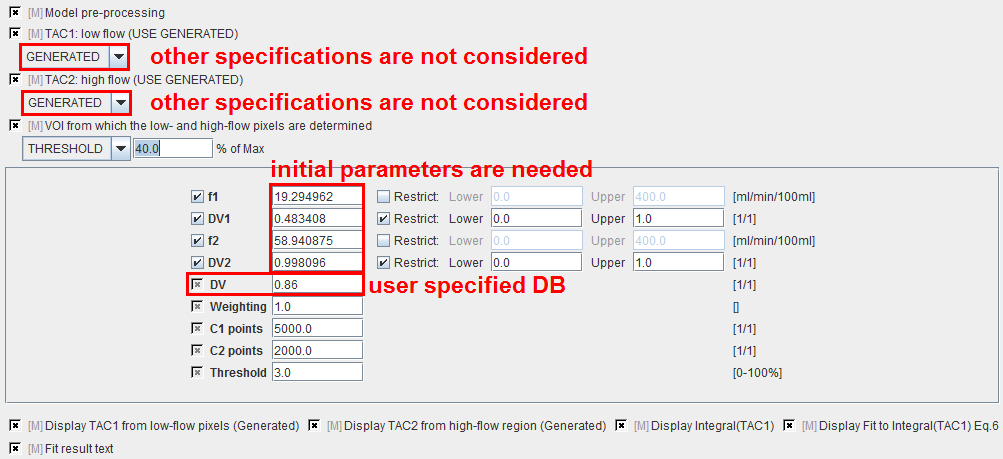
f1 |
Flow in low-flow region estimated during preprocessing and subsequently used in pixel-wise calculations. |
DV1 |
Distribution volume in low-flow region estimated during preprocessing and subsequently used in pixel-wise calculations. |
f2 |
Flow in high-flow region estimated during preprocessing but NOT further used. |
DV2 |
Distribution volume in high-flow region estimated during preprocessing but NOT further used. |
DV |
Fixed distribution volume which is assumed for each pixel-wise TAC. |
Weighting |
Different schemes for residual weighting in the iterative preprocessing fit. |
C1 points |
Number of points used for the generation of TAC1. |
C2 points |
Number of points used for the generation of TAC2. |
Threshold |
Discrimination threshold for background masking. |
After preprocessing, the Watabe plot is shown on the Results panel for inspection. Note that the the integral curves can be deactivated using the check boxes to see the generated TACs.
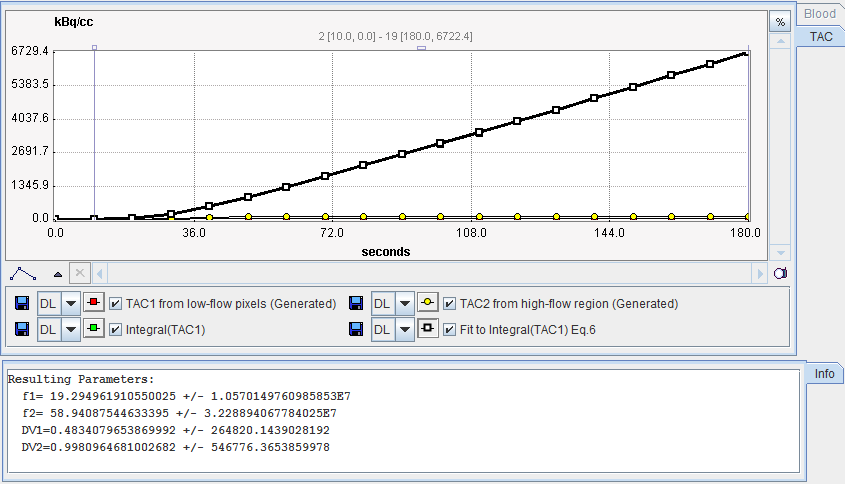
Important Note: Experience has shown that the results of this reference method highly depend on the iterative fit with 4 parameters. As illustrated in this example, the identifiability of the parameters is often poor, and the results may heavily depend on the starting values. In an attempt to make the method more stable, one can fix VD2 to a reasonable value such as 0.9. To this end, just deactivate the box next to VD2 .
Map Parameters

f |
Regional perfusion in [ml/min/100ml]. It is calculated for each pixel by a closed-form calculation (Watabe's eq. 8). Reasonable values are about 30 (white matter) and 60 (gray matter) ml/min/100ml [11]. |