![]()
![]()
![]()
![]()
|
|
|
|
|
The Logan Plot [21] is a graphical analysis technique developed for reversible receptor systems which allows estimating the total distribution volume. The measured TAC CTissue(t) is plotted as follows using the measured and integrated plasma activity Cplasma(t):
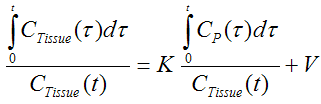
For suitable systems and after sufficient equilibration time this plot will approach a straight line. The slope and the intercept of the line must be interpreted according to the underlying compartment model. The slope represents the total distribution volume of the tracer (including the blood space vB), for the 1-tissue compartment model
K = K1 / k2 + vB
and for the 2-tissue compartment model
K = K1 / k2 (1+ k3 /k4)+ vB