![]()
![]()
![]()
![]()
|
|
|
|
|
Acquisition and Data Requirements
Image Data |
A dynamic PET data set representing the measurements of brain activity from the time of injecting of a 18F-Deoxy-Glucose (FDG) bolus. |
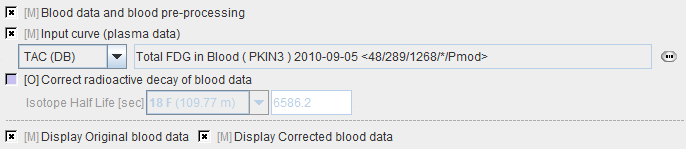
Blood Data |
Plasma activity of blood sampled at a peripheral artery from the time of injection until the end of the acquisition. |
Tissue TAC |
A regional time-activity curve from a brain region. It is presented as a Patlak plot and can be used to define the linear segment where the regression analysis should be done. |
Blood Preprocessing
Decay correction is the only blood correction option. Note that an uncorrected relative time shift of blood data by 30 sec does not markedly change the calculated glucose consumption.
Model Preprocessing
The Patlak graphical plot is performed with the TAC from the specified tissue VOI and presented to the user. Essentially, it is a plot of the TAC with "normalized time" along the x-axis and "normalized" tissue activity on the y-axis. In this plot, the TAC becomes linear after an equilibration time due to irreversible trapping (k4=0). The slope of the linear segment equals the influx constant Ki and can be used to calculate metabolic rate of glucose. The user must decide on the begin of the linear segment in the "normalized" time units and specify the corresponding acquisition start time t* in the model configuration. An alternative is to apply the automatic criterion Max. Err. for fitting t*.
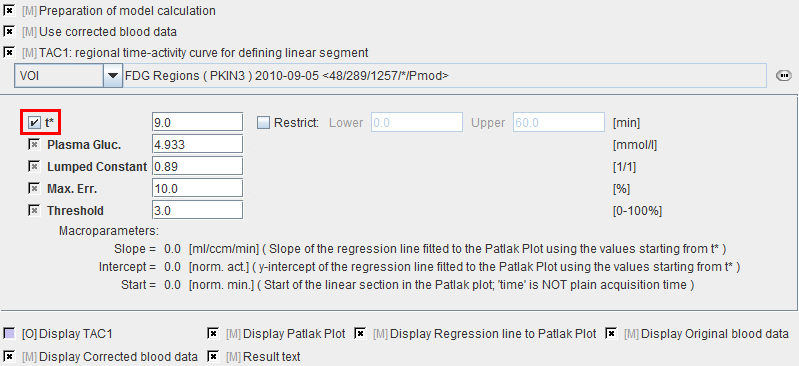
t* |
The linear regression estimation should be restricted to a range after an equilibration time. t* marks the beginning of the range used in the multi-linear regression analysis. It can be fitted based on the Max. Err. criterion. Note that the t* is in acquisition time. |
Plasma glucose |
Plasma glucose in [mmol/l] measured with a blood sample of the patient. |
Lumped constant |
The Lumped constant is used to compensate for the difference in uptake between normal glucose and Fluoro-Deoxyglucose (FDG). Proposed as the default is the value determined by Graham et al (J Nucl Med 2002; 43:1157–1166) using 11C Glucose and FDG in 2002. Their results: Normal brain: 0.89+/-0.08; cerebellum: 0.78+/-0.11. |
Max. Err. |
Maximum relative error ( (measured-predicted)/predicted ) allowed between the linear regression and the Patlak-transformed measurements in the segment starting from t*. |
Threshold |
Discrimination threshold for background masking. |
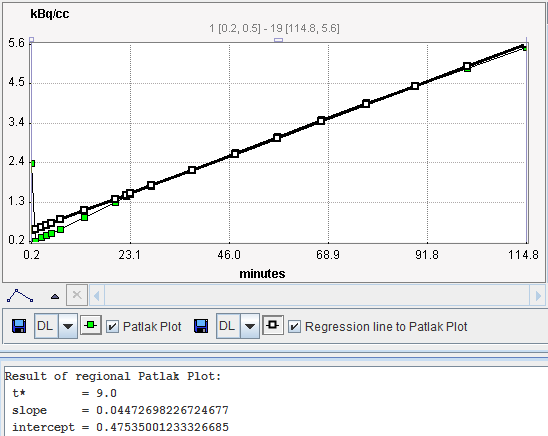
Slope |
Slope of the linear regression, ie. Ki. |
Intercept |
Intercept of the linear regression. |
Start |
Time corresponding to t* in the Patlak plot. |
The Patlak plot is shown in the preprocessing Result. The user should consult this plot in order to check whether the t* time is adequate.
Map Parameters
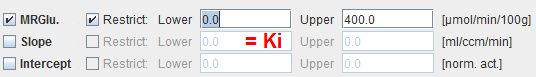
MRGlu |
Metabolic Rate of Glucose in [mmol/min/100ml], the actual result of the model. It is calculated as: MRGlu = (1/Lumped_Constant)*Slope*Plasma_Glucose |
Slope |
Slope of the linear regression. It equals the influx Ki=(K1*k3)/(k2+k3) of the 2-tissue compartment model and is directly proportional to MRGlu. |
Intercept |
Intercept of the linear regression. |