![]()
![]()
![]()
![]()
|
|
|
|
|
The MRGlu (FDG Patlak) model is intended for the quantitative assessment of the regional metabolic rate of glucose (MRGlu) with FDG. The required measurements are a dynamic PET scan after the injection of a FDG bolus and external blood sampling. The analysis is done using the Patlak graphical plot method which has been developed for systems with irreversible trapping, ie. k4=0 in a 2-tissue compartment model.
The Patlak plot belongs to a group of graphical analysis techniques, whereby the measured TAC undergoes a transformation and is plotted against some sort of "normalized time". It is given by the expression
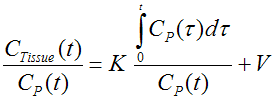
For systems with irreversible compartments such as FDG this plot will result in a straight line after a sufficient equilibration time t*. The Patlak plot is applied to the pixel-wise time-activity curves and a regression line is fitted through the linear segment. The metabolic rate of glucose MRGlu is then obtained from the regression slope by the equation MRGlu = slope * PG / LC, where LC denotes the Lumped Constant, and PG the Plasma Glucose level of the patient.