![]()
![]()
![]()
![]()
|
|
|
|
|
The transformation of the plasma activity curve into the input curve is governed by the configuration on the Metabolites tab. Two cases are to be distinguished.
Measured Parent Fraction Data is available
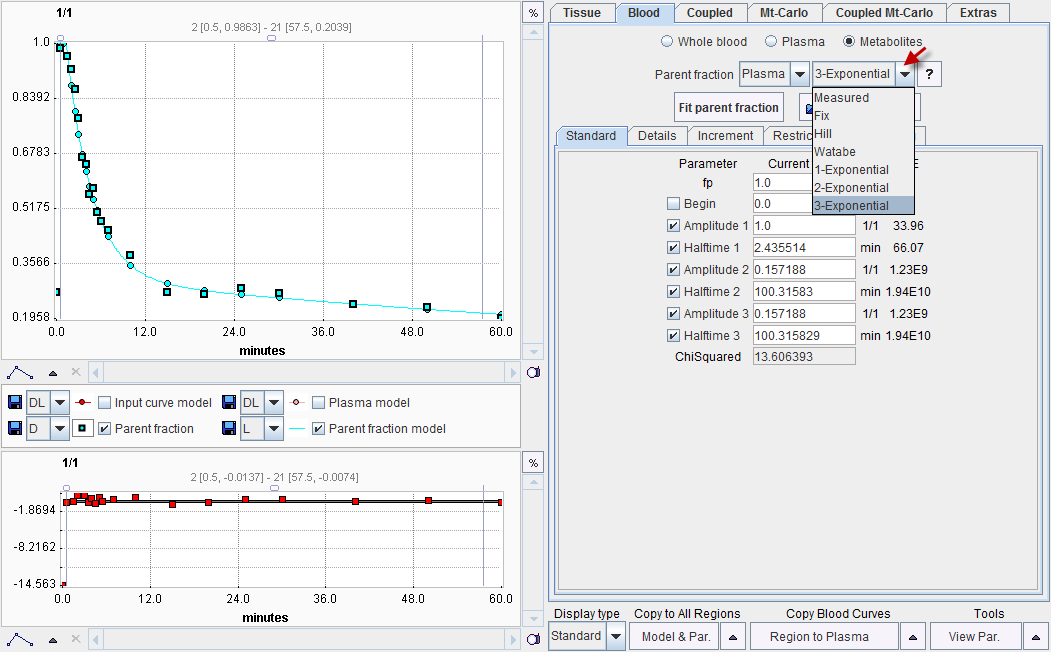
If a parent fraction curve has been loaded, it is shown in the curve area. Initially, the parent fraction model is set to Measured so that linear interpolation between the samples is used to calculated intermediate parent fractions. The model selection choice allows to select smoother models, and fit them to the measurements using the Fit parent fraction button as illustrated below.
No Parent Fraction Data available
If no data parent fraction data have been loaded, the parent fraction model is set to Fix with a free parent fraction fp=1. This is adequate for all tracers which do not require metabolite correction, and for cases when the metabolite correction has already been applied to the plasma data prior to loading them with Load Plasma Curve.
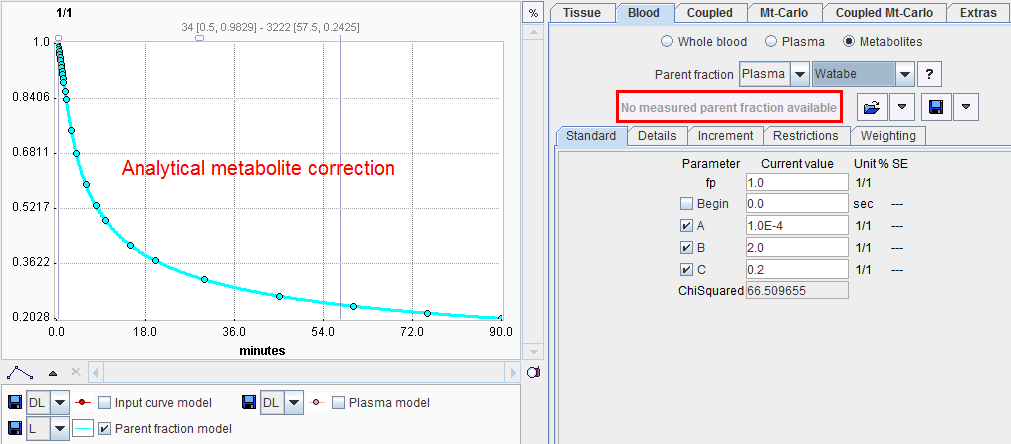
In the case of a tracer which shows a characteristic buildup of the metabolites it may be possible to derive an average parent fraction curve and fit a model to it. To apply a metabolite correction the user can then simply select the appropriate model function and enter the demographic parameter values, as illustrated below. To apply a demographic correction, it must be ensured that time zero of plasma data always represents the time of tracer injection. Naturally, no fit will be possible in this situation.
Parent Fraction Models
The following parent fraction models are available. All of them include the constant fp which must be determined externally and which is set to 1 per default. For information about the fitting options please refer to fitting of kinetic models.
|
Fix |
The concentration of free tracer is proportional to the concentration of the loaded plasma curve.
There is nothing to fit with the Fix model. |
|
Measured |
The ratio unchanged/total tracer in plasma has been experimentally determined and loaded. Linear interpolation is used for the calculation of intermediate fraction values.
There is nothing to fit with the Measured model. |
|
Hill |
The parent fraction is described by a Hill function
with a delay t0, and 0<A<=1, B>0, C>0. The delay allows for an initial phase during the infusion without tracer metabolites. This function was used with 11C-WAY-100635 data [53]. |
|
Watabe |
The functional form introduced by Watabe for 11C-MDL-100907 data [54]:
with a delay t0. |
|
1-Exponential |
The functional form described by Wu et al for 11C-WAY-100635 data [55]:
with a delay t0. fparent(t) is forced to fp at time t0. |
|
2-Exponential |
The functional form described by Wu et al for 11C-WAY-100635 data [55]:
with a delay t0. fparent(t) is forced to fp at time t0. |
|
3-Exponential |
Sum of three decaying exponentials
with a delay t0. There is no restriction that fparent(t) equals fp at time t0. |
Note: The metabolite correction is applied to the plasma curve using the original plasma sampling times. The assumption is that the parent fraction and the plasma curve have a common time scale. Only after the metabolite correction has been applied is the input curve shifted by the blood sampling time delay.