Curve Layout
The curve display supports the visualization of the different loaded measurement as well as the calculated model curves. The available curves depends on the selected tab.
Curves with selected Tissue Tab
After data loading the time-activity informations of the current region are shown in the curve display in a default layout. The large area contains
- the Measured TAC values representing the tissue TAC;
- the Input curve model which is used as the input curve for the model calculations; it is calculated from the available plasma data;
- the Whole blood model used for blood spillover corrections;
- and the Model Curve which results from evaluating the current model configuration with the input curve.
- Initially, only the Measured TAC and the Model Curve are enabled for display by the check box in the control area. Depending on the context some additional curves available for display which are hidden per default (box initially not checked). In the example below the compartment concentrations C1 and C2 of the 2-Tissue compartment model can be shown.
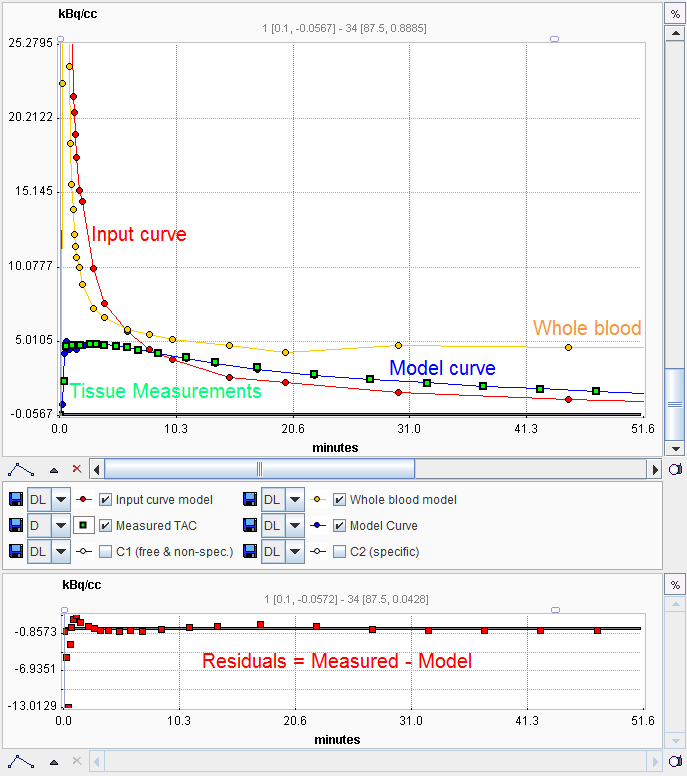
The small residuals curve display at the bottom visualizes the agreement between the measurements and the model curve. The aim is to find a model which has no significant trend in the residuals left.
The general manipulations available in the PMOD curve display are explained in the next section.