![]()
![]()
![]()
![]()
|
|
|
|
|
An important usage of the VOI analysis is the generation of time-activity curves (TAC) for subsequent kinetic modeling. This can easily be achieved in PVIEW by the following steps
1. Definition of the VOIs
The image data is loaded as a dynamic series with the correct acquisition times and the correct input units. This is important, because otherwise the acquisition start/end times in kinetic modeling will be wrong, and the TACs may be different in magnitude with respect to the blood data. Such problems result in erroneous model parameters.
In dynamic image series there is generally not enough anatomical information to delineate VOIs. Often, averaging of a subset of the acquisition frames resolves the problem. The VOIs are then delineated in the summed images, transferred to the dynamic images, and optionally saved to a file.
2. TAC generation
Switch the tool to the dynamic study, and activate the button
![]()
A dialog window appears which allows defining the proper type of the calculated TACs (REGION = tissue TAC, INPUT = plasma curve, SPILLOVER= total blood curve)
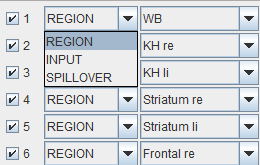
The window is organized in three panels:
NOTE: The selection in the right panel (blue) does not affect the selection on the left panel (red) while the selection on left panel is immediatly reflected in both display area and right panel.
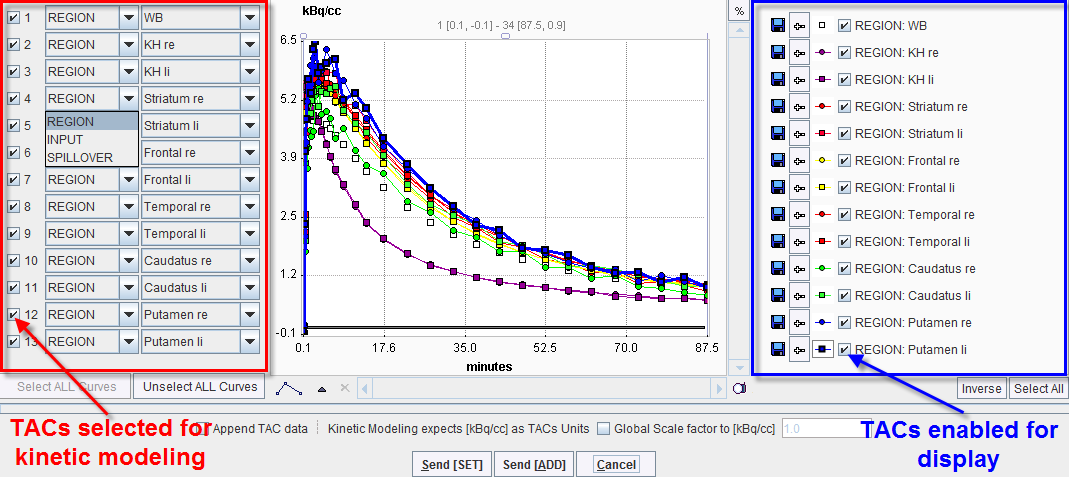
The Send buttons initiate the transfer of the activity curve data to the PKIN tool. Selecting the Send[SET] button transfers the TAC data to the currently selected tab in the PKIN tool. If the Append TAC Data box is checked, the curves are appended as new curves to the data existing on the PKIN tab, otherwise the data is over-written. Send[ADD] first creates a new tab in PKIN, to which the data is added. If PKIN is not running, the tool is first started and the data added.
The +- button in the curve controls allow for simple operations such as curve scaling before sending the data to PKIN. Both the average value and the standard deviation within the VOIs are transferred, as well as patient and study information. The standard deviation may be used for weighted fits in PKIN.
If the PKIN option is not available, the TACs of a dynamic series can also by obtained with the statistics button as illustrated below.
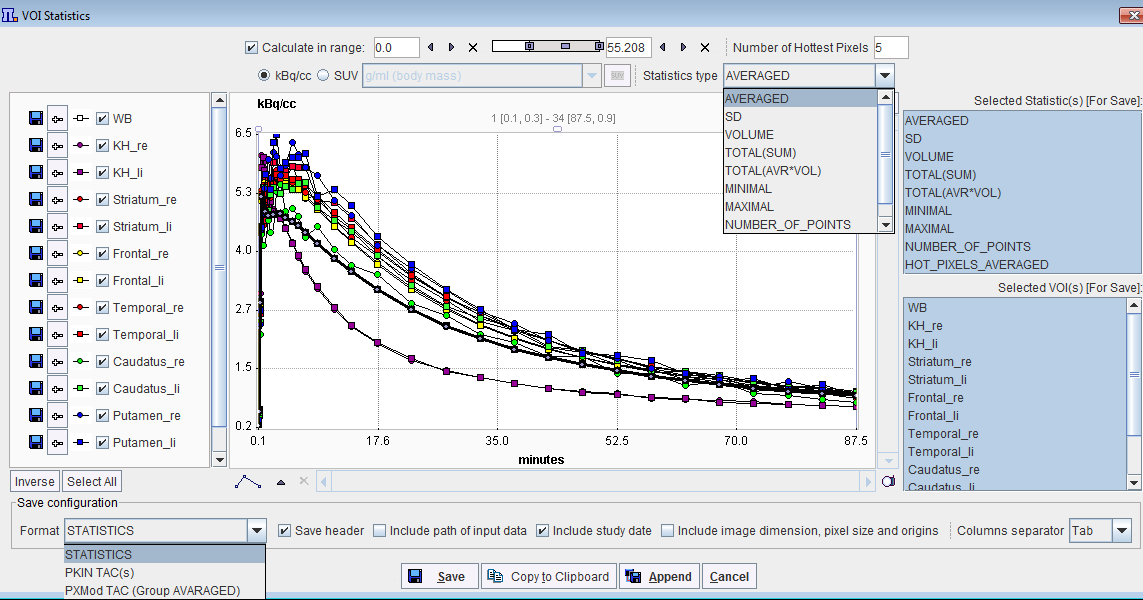
The Calculate in range box allows restricting the TACs statistics to the subset of pixels with values in a specific range.
Note the radio box in the upper section which allows switching between kBq/cc and the SUV, if all required information is available. The Statistic type selection list allows choosing the type of statistics to be displayed in the graphic area.
The statistics numbers selected in the Selected Statistic(s) [For Save] area of the VOIs selected in Selected VOI(s) [For Save] can be saved into a text file with Save, appended to an existing one using Append, or copied or the Clipboard.
There are different statistic formats available for saving procedure: