![]()
![]()
![]()
![]()
|
|
|
|
|
Ichise's MA1 analysis method is a technique for calculating the total distribution volume of reversible receptor systems. It is a further development of the Logan Plot aimed at minimizing the bias induced by noise in the measurements. The following bilinear relationship was derived [34]:
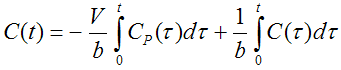
where C(t) represents the tissue time-activity curve, Ca(t) the plasma activity, V the total distribution volume, and b the intercept of the Logan plot which becomes constant after an equilibration time t*. In PKIN, the bilinear regression is performed using a singular value decomposition. The result are the two coefficients V/b and b, from which V can easily be derived.
Based on simulation and experimental data the authors show that MA1 demonstrates the largest bias reduction among several methods. Therefore they conclude, that MA1 is the method of choice for calculating the total distribution volume, if t* can accurately be defined.
Implementation Notes
The MA1 method requires the specification of the the equilibration time as the t* parameter. Similar to the Patlak and Logan methods, t* can be fitted. As it equals the equilibration time of the Logan plot, it is also possible to perform a Logan plot first and use its equilibration time.
Abstract [34]
"In an attempt to improve neuroreceptor distribution volume (V) estimates, the authors evaluated three alternative linear methods to Logan graphical analysis (GA): GA using total least squares (TLS), and two multilinear analyses, MA1 and MA2, based on mathematical rearrangement of GA equation and two-tissue compartments, respectively, using simulated and actual PET data of two receptor tracers, [(18)F]FCWAY and [(11)C]MDL 100,907. For simulations, all three methods decreased the noise-induced GA bias (up to 30%) at the expense of increased variability. The bias reduction was most pronounced for MA1, moderate to large for MA2, and modest to moderate for TLS. In addition, GA, TLS, and MA1, methods that used only a portion of the data (T > t*, chosen by an automatic process), showed a small underestimation for [(11)C]MDL 100,907 with its slow kinetics, due to selection of t* before the true point of linearity. These noniterative methods are computationally simple, allowing efficient pixelwise parameter estimation. For tracers with kinetics that permit t* to be accurately identified within the study duration, MA1 appears to be the best. For tracers with slow kinetics and low to moderate noise, however, MA2 may provide the lowest bias while maintaining computational ease for pixelwise parameter estimation."