![]()
![]()
![]()
![]()
|
|
|
|
|
The 3 Comp, Metabolites model has been used for modeling 123I epidepride as described by Fujita et al. [39]. It is a receptor model with two input curves, the usual input curve of free ligand in plasma, but also a second input curve of lipophilic metabolites which may cross the blood-brain-barrier and undergo non-specific binding in brain tissue.
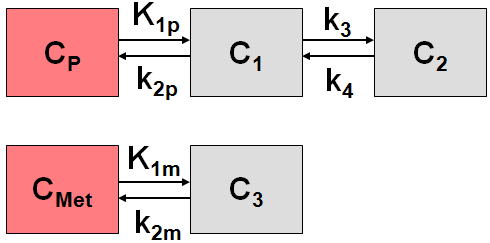
C1 includes free and non-specific binding of authentic ligand (non-displaceable), C2 represents the specific binding of interest, and C3 represents free and non-specific binding of metabolized ligand.
The differential equations are as follows:

Implementation Notes
The Load input curve entry in the File menu has two sub-menus Plasma and Metabolites for loading the two input curves. There are two implementations of the model, one with the direct rate constants, and another with three ratios of rate constants. The ratios represent the distribution volumes of non-displaceable binding and the metabolites in tissue, as well as the delivery ratio (see parameter tooltips in PKIN). The purpose of these ratios is to introduce constraints for coupled fitting as described in [39].
Abstract [39]
Quantitative SPECT measures of dopamine D(2) like receptors with [(123)I]epidepride is complicated by its high affinity and lipophilic metabolites. The purpose of this study was to use both parent (P) and lipophilic metabolites (M) as input functions in a kinetic paradigm and in comparison to the results of equilibrium studies. Kinetic studies on eleven healthy human subjects, ages 32+/- 10 were performed following i.v. injection of approximately 370 MBq of [(123)I]epidepride. Images were acquired for 13.5+/-1.0 hours. Equilibrium studies were done on seven of eleven subjects with a bolus injection of approximately 140 MBq, bolus/infusion ratio of 10 hours, and infusion for 30-32 hours. High (striatum) and low (temporal cortex) density regions were studied. Two (P and M) and one (P) input function models were applied in the kinetic studies. In receptor-rich regions, the distribution volumes in nondisplaceable compartments were fixed to those in cerebellum. In addition, in the two input function model, K(1)(P)/K(1)(M) was fixed to the values in the cerebellum. The one input function model provided V'(3) values (=f(1)*B'(max)/K(D)) which were consistent with those obtained in equilibrium studies in both receptor-rich regions, while the two input function model provided consistent values only in striatum. Poor identifiability of the rate constants of metabolites seemed to be the source of errors in the two input function model. These results suggest that correct V'(3) values can be obtained with the one input function model both in high- and low-density regions.