Several reports are available and can be generated using the report selection.
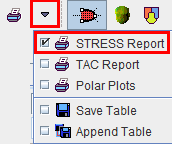
Main Report (STRESS, REST separate)
The illustration below shows a STRESS Report example. Note the results of the different segments, which are summarized by volume-weighted averaging to the vascular territories LAD, RCA, LCX, and to a GLOBAL average. TOTAL represents the kinetic modeling result which was obtained by fitting the TAC composed of volume-weighted contributions from all segments. It can be used as a double-check that the segmental results are reasonable.
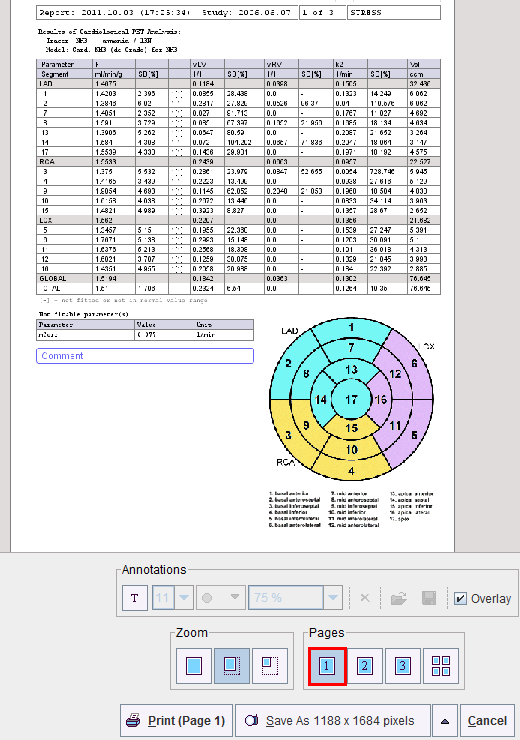
Note the buttons Print for printing a hardcopy of the report, and Save as for saving the report in a graphic format (JPEG, TIFF) or in DICOM. The latter button can be switched to generate a capture with lower resolution.
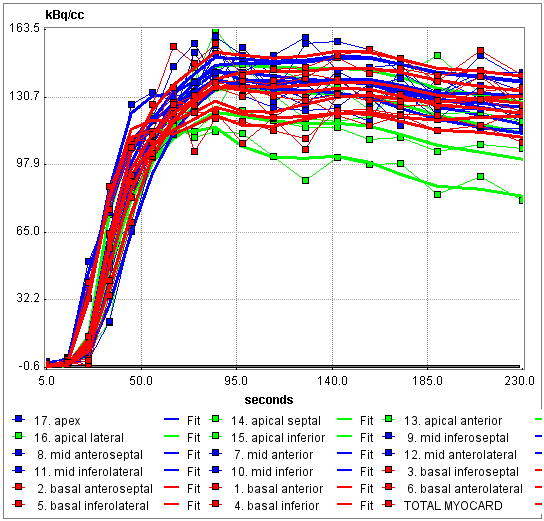
The second page of the main report shows the segmental TACs
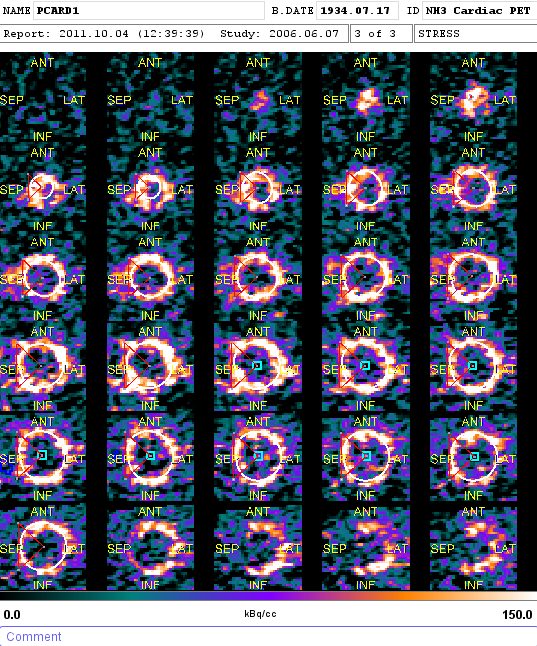
The third page allows to print images from the dynamic study in SA orientation. The report layout is fixed to 6x5 images such that 30 slices images are always visible. To change the appearance just click into the image area and adjust the visible frame and the color display range.
TAC Report
The TAC Report shows the segmental TACs together with the fitted model curve and the model result parameters. Note the different pages which are needed to document all segments.

Polar Plot Report
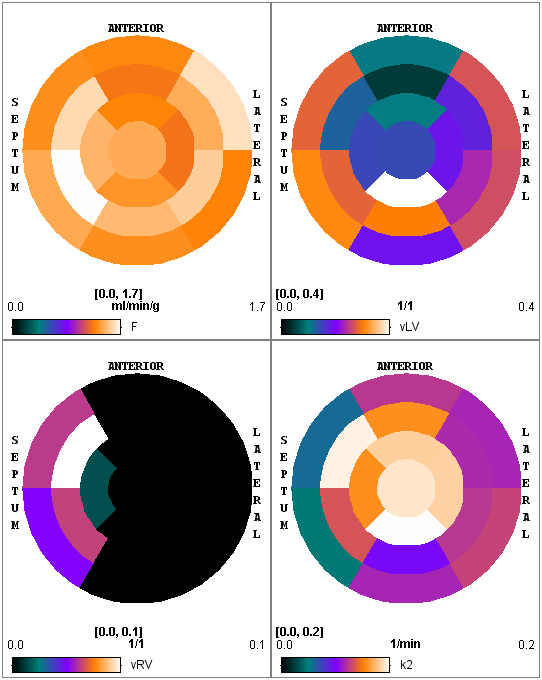
The Polar Plots report allows to summarize the result parameters as polar plots. Note in the example below how the right ventricle spillover vRv parameter is only fitted in the septal segments.
Save Numeric Results
The numeric results contained in the main report can be saved using the entry Save Results. This generates a simple ASCII text file which can be opened in many editors as well as in MS Excel, for further processing. Use the entry Append Results to append the results to an existing file.