![]()
![]()
![]()
![]()
|
|
|
|
|
PCARD supports different segmentation models. Currently, the standard AHA 17-segment model is available, as well as the ASNC 20-segment model which is often used with SPECT data.
For using a particular segment model the corresponding tab should be selected. During the analysis one time-activity curve per segment is calculated by averaging the signals from all voxels belonging to the segment. It is then fit to a kinetic model, which results in one set of parameters. The result parameters from all segments are finally displayed as polar plots corresponding the segmentation scheme, and used for generating comprehensive reports.
CAUTION: A single segmentation must be employed in order to create a normal database, and when comparing patient data against such a database.
Polar Sampling
The Polar Sampling selection defines how the voxels used in the segment TAC calculation are located. PCARD interpolates the axial range defined by the myocardium model into 20 slices. For each of these slices a radial sampling is performed every 10°. There are three different ways how the myocardium samples are detected:
Radial Maximum |
Using the maximum value on the radial profile. The Wall thickness determines the range from the model within which the maximum is determined. |
Model Crossing |
Using the value at the intersection of the radial profile with the myocardial model. |
Averaged on Model Crossing |
Using a neighborhood of voxels at the intersection of the radial profile with the myocardial model. |
Averaged on Radial Maximum |
Using a neighborhood of voxels around the determined profile maximum. |
Note: the sampling points found by a prescribed sampling scheme can be visualized as circles in the short axis images or as spheres in a 3D rendering (see Examining the Results)
As a means to get a robust global result PCARD allows averaging the signals from all segments into a single TAC TOTAL MYOCARD. This TAC is only generated, if the box Calculate TAC of total myocardium is checked.
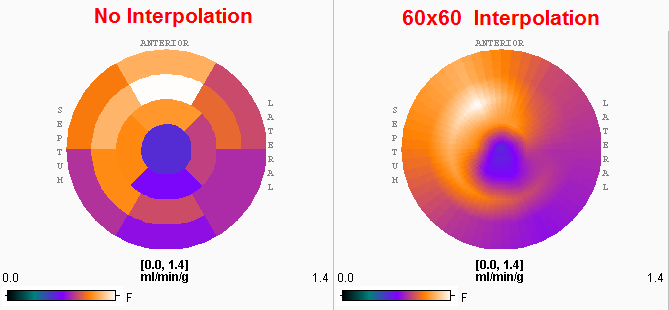
The Polar plot interpolation choice defines how the information calculated in the segments is presented in the polar plots. If it is set to NO, the segment structure is clearly visible. If set to 48x48, values at 48 radial distances and 48 angular increments are interpolated, and similarly with the or 60x60 setting. The effect is illustrated in the example below. While the raw polar plot represents the true numbers, the values are smeared by the interpolation filtering.